
Figure 3.
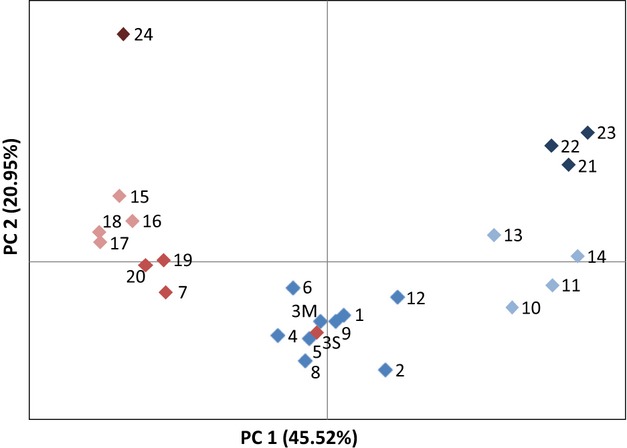
Principal coordinates analysis of the 25 An. gambiae samples. Each mark represents a sample numbered according to Fig. 1. Marks are colored according to the within-form genetic clusters revealed by structure (Fig. 2). Blue: M-west, light blue: M-central, dark blue: M-south; red: S-west, light red: S-central, dark red: S-east.