
Figure 5.
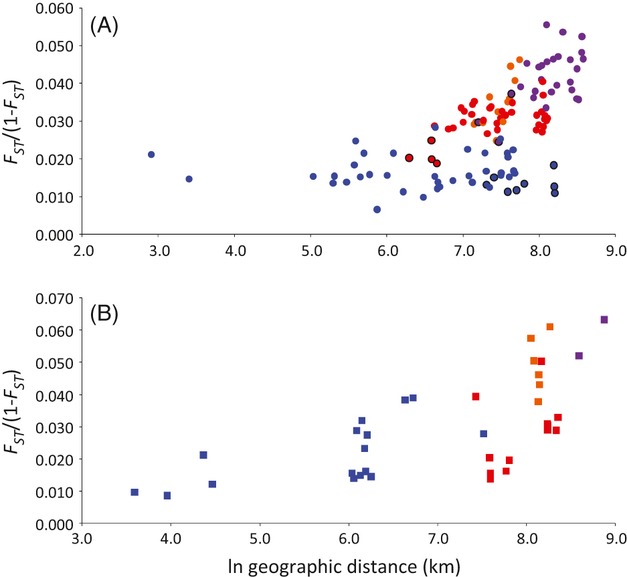
Plots of the regression between FST/(1-FST) and logarithmic geographic distance. (A) M-form. Blue circles: comparisons between localities for which the majority of individuals were assigned to the same genetic cluster (i.e. M-west, M-central, and M-south). Red circles: comparisons between M-west and M-central localities. Orange circles: comparisons between M-central and M-south localities. Purple: comparisons between M-west and M-south localities. Circles with a black line correspond to comparisons involving the locality of Bayanga (CAR), which was considered as representative of the M-west cluster. (B) S-form. Blue squares: comparisons between localities belonging to the same genetic cluster (i.e. S-west, S-central, and S-east/Mozambique). Red squares: comparisons between S-west and S-central localities. Orange squares: comparisons between S-central localities and S-east/Mozambique. Purple squares: comparisons between S-west localities and S-east/Mozambique.