
Figure 2.
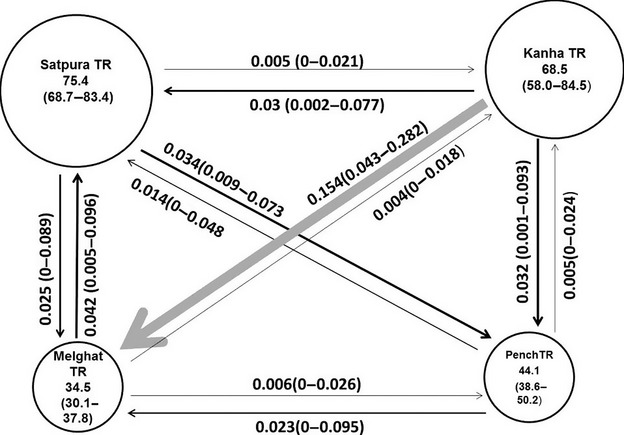
Contemporary gene flow (m, results from BAYESASS) and effective population sizes (Ne, results from ONESAMP) in the central Indian leopard meta-population. Numbers inside circles represent effective population sizes, and those above arrows represent migration rates in the direction of the arrow. Numbers in brackets are 95% confidence intervals. Thickness of arrows and diameter of circles are scaled according to their values.