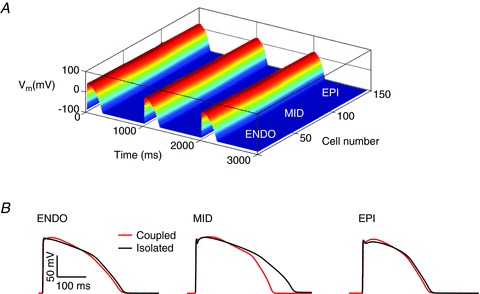
Figure 1. Effect of electrotonic coupling.

A, simulation of action potential propagation in a cable of ventricular cells. Three beats of the simulation paced at 1 Hz at the endocardial terminal of the cable are shown. B, comparison of action potential waveforms for endocardial (ENDO), mid-myocardial (MID) and epicardial (EPI) cells either simulated in isolation, or in the presence of electrotonic coupling (extracted from the cable in A).
