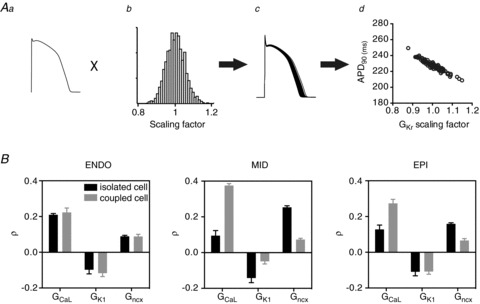
Figure 2. PLS regression.

A, simulation pipeline for PLS analysis. Ionic conductances in the baseline model defining the action potential (a) are modified according to a log–normal distribution of randomised scaling factors (b). This process is repeated 100 times to yield a family of action potentials (c). The relationship between action potential parameters such as APD90 and variability in individual ionic conductances can be represented on a scatter plot (d). B, comparison of PLS sensitivities (ρ) for APD90 of action potentials simulated in isolation or as part of a cable for endo-, mid-myo- and epicardial cells.
