
Figure 6. Effect of heart rate on ECG sensitivities.
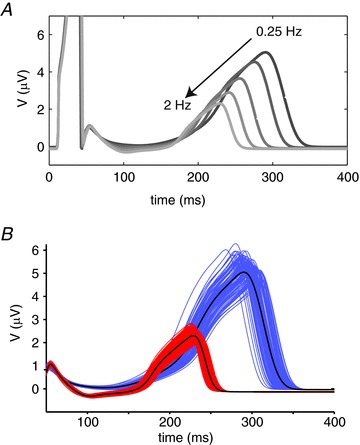
A, pseudo ECGs simulated at pacing frequencies between 0.25 and 2 Hz. B, T waves from families of 100 ECGs simulated according to the randomisation pipeline in Fig. 2A at 0.25 Hz (blue) and 2 Hz (red) after equilibration for 500 beats.