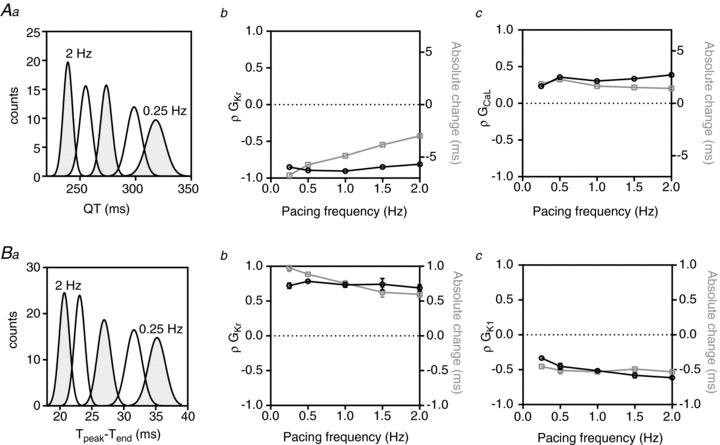
Figure 7. Rate dependence of QT and Tpeak– Tend sensitivities.

Aa, QT interval distributions at pacing rates between 0.25 and 2 Hz. Ab and c, rate dependence of PLS regression coefficients (ρ, black line) and absolute changes (grey line) in QT interval associated with GKr (b) and GCaL (c). Ba, Tpeak– Tend distributions at pacing rates between 0.25 and 2 Hz. Bb and c, rate dependence of PLS regression coefficients (ρ, black line) and absolute changes in Tpeak– Tend (grey line) associated with GKr (b) and GK1 (c).
