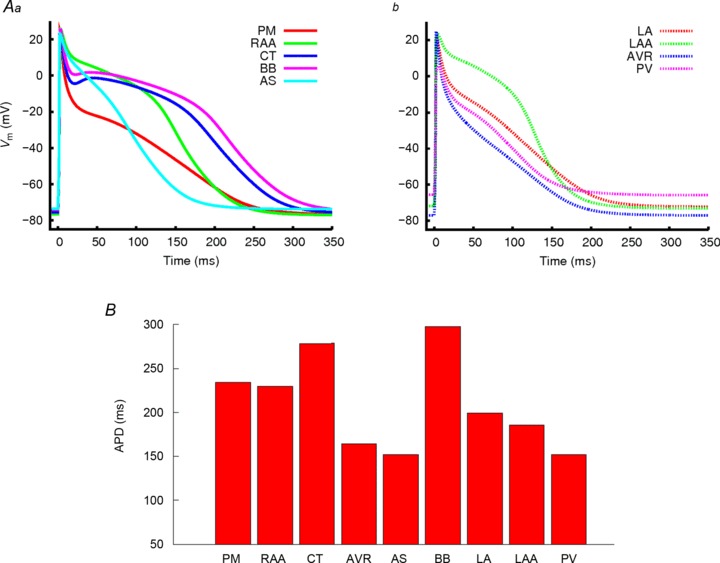
Figure 2. APs computed from regional atrial cell models and their APDs.

A, AP traces for the regional cell models for (a) the pectinate muscle (PM, solid red), right atrial appendage (RAA, solid green), crista terminalis (CT, solid blue), Bachmann's bundle (BB, solid pink) and atrial septum (AS, solid light blue), and (b) left atrial wall (LA, dotted red), left atrial appendage (LAA, dotted green), atrio-venrticular ring (AVR, dotted blue) and the pulmonary veins (PV, dotted pink). B, plots of APD90 for each of the different regional cell models measured at a BCL of 1000 ms.
