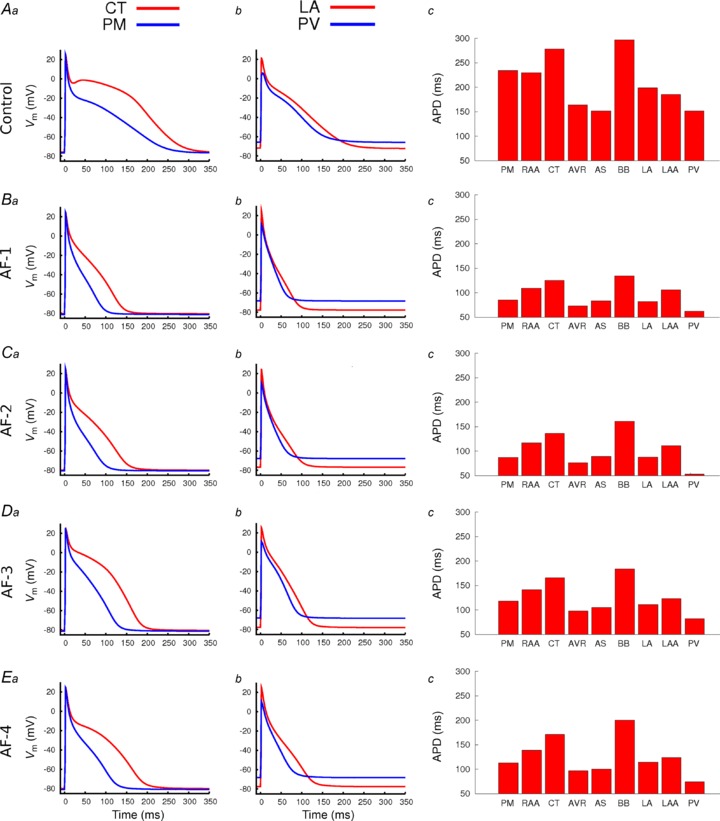
Figure 4. Effect of AF-induced remodelling on AP regional heterogeneity.

Comparisons were made at the junctions of the CT/PM and LA/PV. For each panel, APs are overlain for the CT and PM (a), LA and PV (b), whilst APD90 for all regional cell models are shown in c. A, data in control; B–E, data for the different AF-induced remodelling conditions (as indicated on the left hand side of a in each row).
