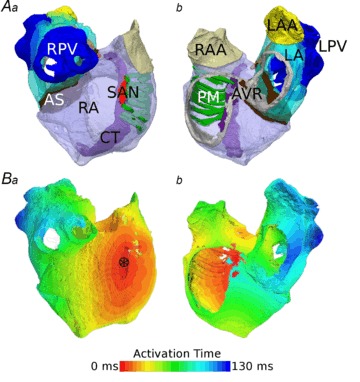
Figure 5. 3D anatomical model.

A, fully segmented atria from two different views (a– looking at the RA wall, b– view into the atrial cavities), with the RA in transparent purple, CT in solid purple, PMs in green, SAN in red, AS in brown, LA in transparent light blue, PVs in solid dark blue, RAA in beige, LAA in yellow and AVR in grey. All regions are labelled. B, normal activation in the fully segmented model from the same views. Please note this has been paced from the SAN region, indicated by the asterisk in a.
