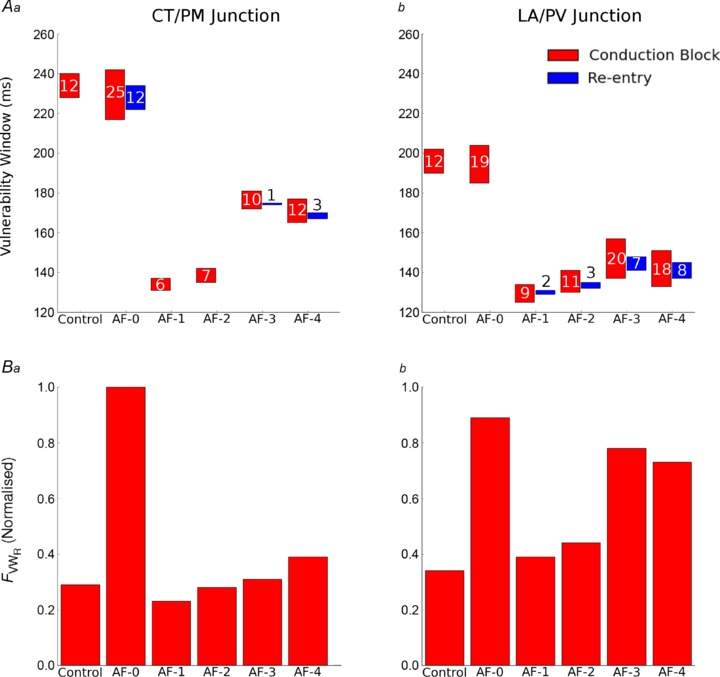
Figure 7. Measured time window for unidirectional conduction block and re-entry.

A, time window of vulnerability measured in the 3D human atria at the CT/PM junction (a) and LA/PV junction (b). The time window for unidirectional conduction block is shown in red and sustained re-entry in blue. Where there is no blue box, sustained re-entry could not be initiated. The width of the window (ms) is labelled by the numbers within or above each box. B, magnitude of FVWRat each of the two regions is plotted for each condition. Magnitudes are normalised to the value obtained in AF-0 at the CT/PM junction.
