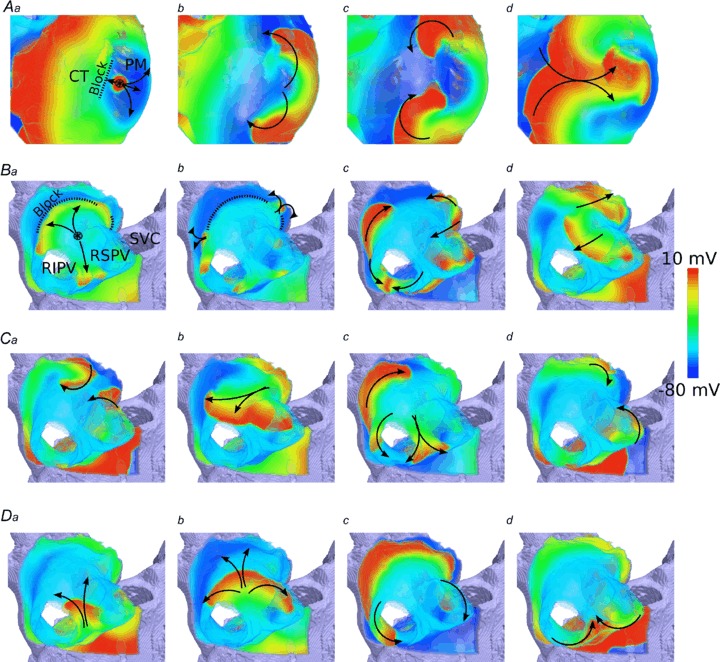
Figure 8. Initiation of re-entry by S1–S2 protocol.

A, snapshots of initiated re-entry at the CT/PM junction at a time after the S2 stimulus: t= 5 ms (a), 70 ms (b), 115 ms (c) and 175 ms (d). B, snapshots of initiated re-entry in the PVs at a time after the S2 stimulus: t= 35 ms (a), 55 ms (b), 70 ms (c) and 190 ms (d). C and D, two illustrations of final re-entrant pathways emerging in the PV region. Distribution of the membrane potential in the 3D atrial tissue is shown using a standard rainbow palette. Dotted line means functional conduction block. Arrows indicate wave propagation. Circle with an asterisk is the location of the applied stimulus.
