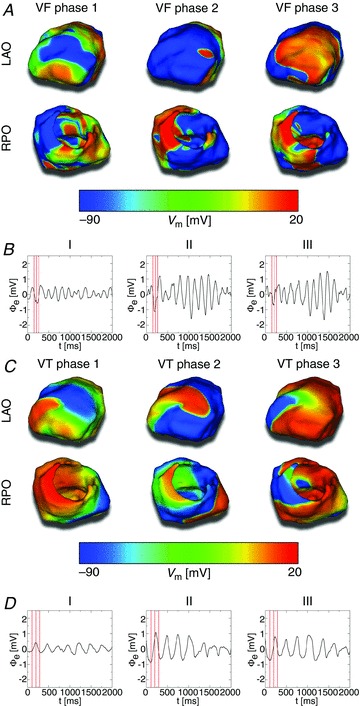
Figure 4. Ventricular fibrillation and tachycardia.

A, left anterior oblique (LAO; top row) and right posterior oblique (RPO; bottom row) Vm maps of the three VF phases to which defibrillation shocks were applied. B, limb lead ECG traces of VF. Red lines mark the three VF phases from A. C, LAO and RPO Vm maps of the three VT phases to which cardioversion shocks were applied. D, limb lead ECG traces of VT. Red lines mark the three VT phases from C.
