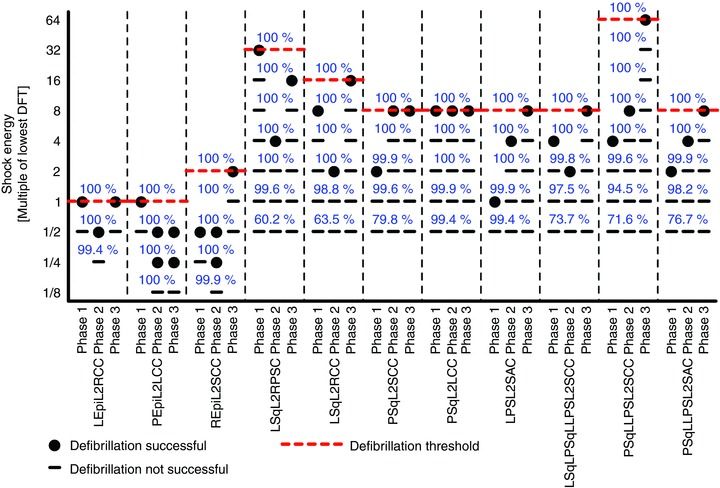
Figure 5. Defibrillation threshold grid.

DFTs for the 11 tested ICD configurations. Red dashed lines mark the DFTs, and blue numbers show the percentage of ventricular volume experiencing Φe gradients ≥5 V cm−1 1 ms after shock onset. ICD configuration notation as in Fig. 2, and VF phases as in Fig. 4.
