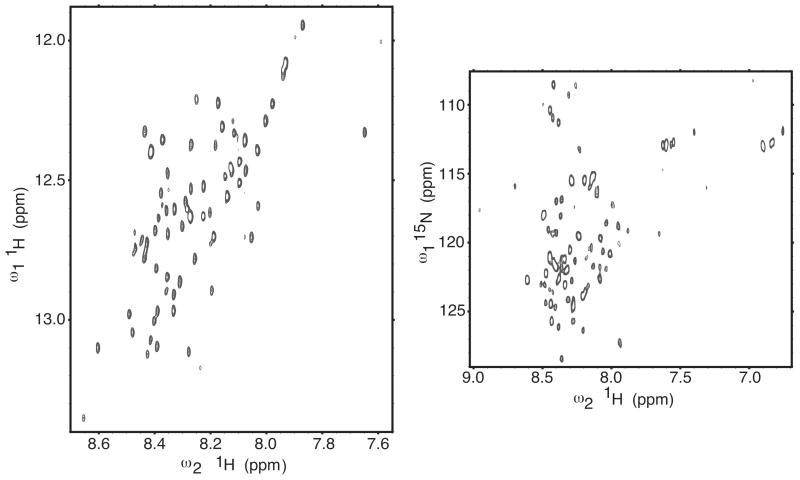
FIGURE 10.
The 2D NMR spectra of the hSVCT2 N-terminus (residues 13-99). Protein sample was at 0.5 mM concentration, pH 7.0, and 295 K (no isotope labeling); data collected at 600 MHz on a non-cryogenic probe. Left panel: NH-αH region of a homonuclear 2-quantum COSY spectrum (the peaks are anti-phase doublets in the directly detected dimension, but for clarity only the positive contour levels are drawn). The horizontal axis shows the NH shifts, and the vertical axis shows the sum of the NH and αH shifts. Right panel: HSQC spectrum for the natural abundance 15N-1H and 15N-1H2 groups.

