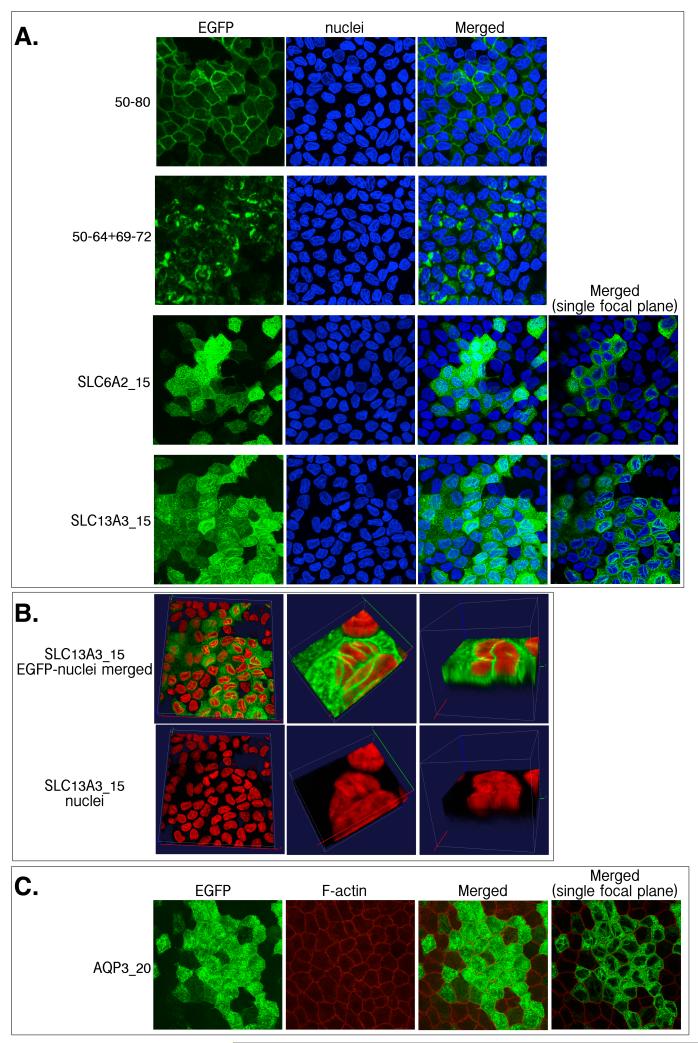
FIGURE 7.
A comparison between the location of EGFP-tagged proteins and nuclei, stained with DAPI (A, B); F-actin, stained with Alexa Fluor® 568-tagged phalloidin (C), in stably-transfected well-differentiated MDCK cells. Cells were briefly fixed with ice-cold 100% methanol and then stained by DAPI or phalloidin immediately for confocal visualization of fluorescence. (B) Enlarged 3-D viewing of DAPI-stained cells to visualize the distribution of linear fluorescence structure around nuclei.

