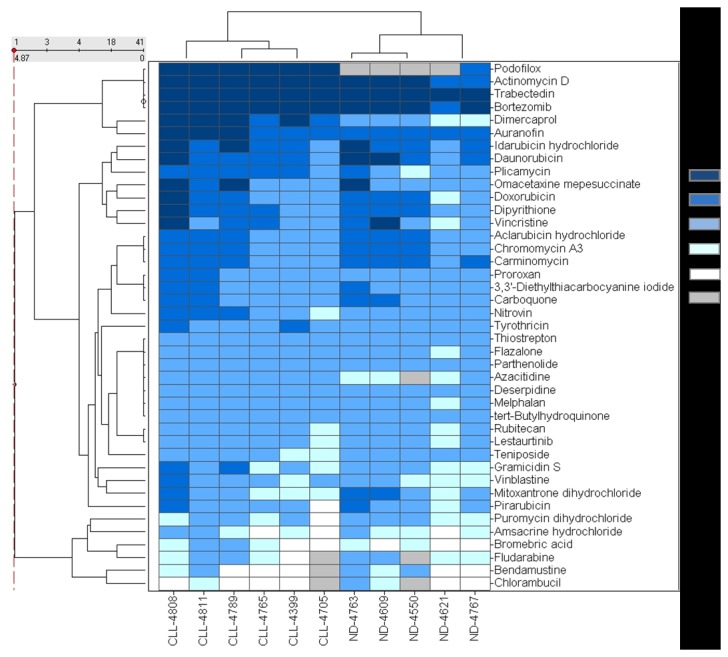
Figure 3. A close-up view of 41 selected compounds with the heat map scaled by the IC50 of the compound in CLL cytotoxicity assay.

The potency categories are shown in different color. Grey bar represents inactive compound.

The potency categories are shown in different color. Grey bar represents inactive compound.