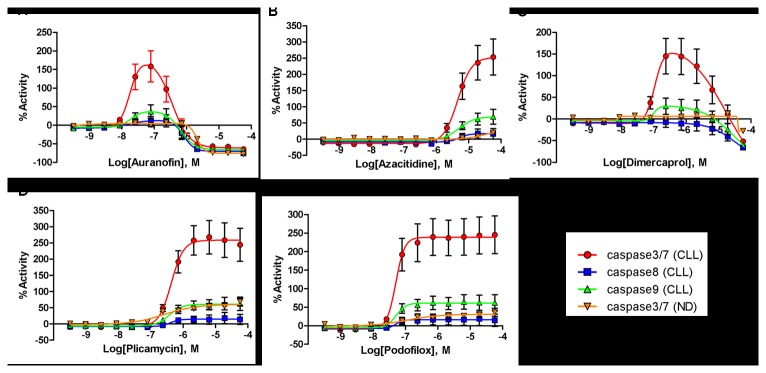
Figure 6. Caspase-3/7, caspase-8 and caspase-9 activation in response to the five selected agents in samples from CLL patients and normal donors.

Each CRC represents the average response of multiple samples testing with error bars demonstrating the SD. The results are shown in %activity of caspase activity in drug treated cells compared to the corresponding DMSO treated controls (0% = DMSO treated control, 100% = 2-fold caspase activity induction of DMSO control).
