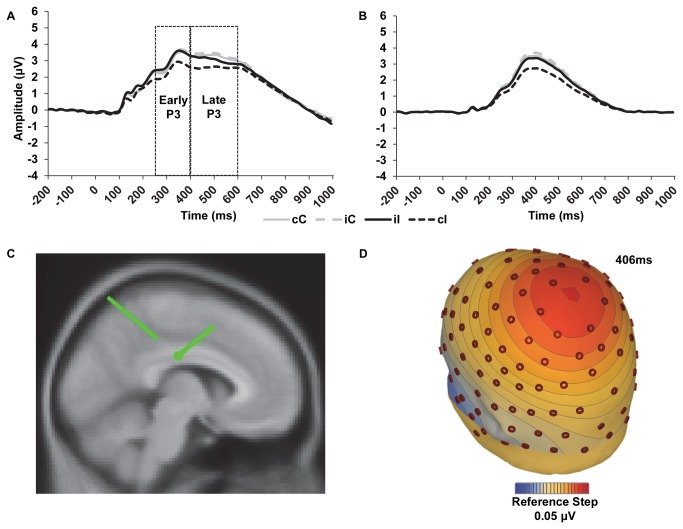
Figure 3. Event-related potential waveforms and source localization.
a) Grand average waveforms depicting P3 activity average across six centro-parietal recording sites as a function of previous- and current-trial congruency. Dotted lines indicate time windows used to extract the early and late P3 activity. b) Portion of P3 captured by temporal factor 1 spatial factor 3 (TF1SF3) as a function of previous- and current-trial congruency and extracted from activity at CPz. c) Sagittal view of dipole source for TF1SF3. d) Voltage map for TF1SF3 iI minus cI activity. cC = congruent trial preceded by a congruent trial, cI = incongruent trial preceded by a congruent trial, iC = congruent trial preceded by an incongruent trial, iI = incongruent trial preceded by an incongruent trial.

