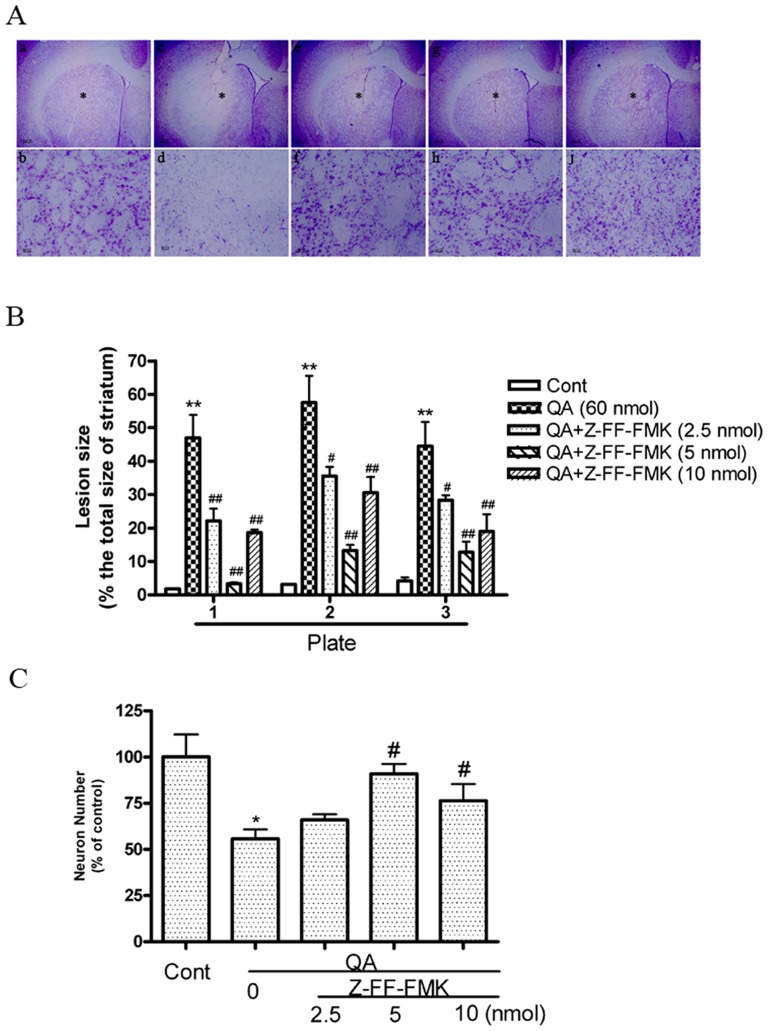
Figure 1. The effects of the cathepsin L inhibitor Z-FF-FMK on QA-induced striatal damage.
Rats were treated with intrastriatal injection of Z-FF-FMK (2.5, 5, 10 nmol), 10 min prior to QA (60 nmol) injection. Rats were killed 14 days after QA treatment. Paraformaldehyde-fixed brain sections were stained with Nissl. A: The effects of Z-FF-FMK on QA-induced striatal damage. Representative micrographs were taken in the center of drug injection (adjacent to needle tracks). a and b: Vehicle. c and d: QA. e and f: QA+Z-FF-FMK (2.5 nmol). g and h: QA+Z-FF-FMK (5 nmol). i and j: QA+Z-FF-FMK (10 nmol). b, d, f, h and j (×200) were enlarged from areas indicated with asterisks in a, c, e, g and i (×20). Scale bar = 200 µm in a, c, e, g and i; scale bar = 20 µm in b, d, f, h and j. B: Quantitative analysis of the effects of Z-FF-FMK (2.5, 5, 10 nmol) on lesion size. Three Nissl-stained sections from each animal were used for quantitative analysis of lesion size caused by QA. Plate 1: sections taken at 1.4 mm anterior to the Bregma. Plate 2: sections taken at 0.6 mm anterior to the Bregma. Plate 3: sections taken at 0.2 mm posterior to the Bregma (The Stereotaxic Atlas of The Rat Brain by Xin-Min Bao, Si-Yun Shu; People's Health Press). Striatal images were captured and exported to Sigma Scan Pro 5 for determining lesion size. Lesion size was expressed as percent of the total size of the striatum of each section. Bars represent mean ± SEM, n = 6 animals per group. Statistical comparisons were carried out with one-way ANOVA followed by Bonferroni t test. C: The effects of Z-FF-FMK on QA-induced loss of striatal neurons. 12 Nissl-stained sections (with the interval of every 14 successive brain sections) were used for counting neuronal numbers with an Optical Fractionator microscope and stereology software. The neuronal number of the total striatum was expressed as percent of control (vehicle-treated group). Bars represent mean ± SEM, n = 6 animals per group. Statistical comparisons were carried out with one-way ANOVA followed by Bonferroni t test. The difference was not statistically significant between QA and QA+Z-FF-FMK (2.5 nmol) treatment. * P<0.05 vs. control group; ** P<0.01 vs. control group; # P<0.05 vs. QA-treated group; ## P<0.01 vs. QA-treated group.

