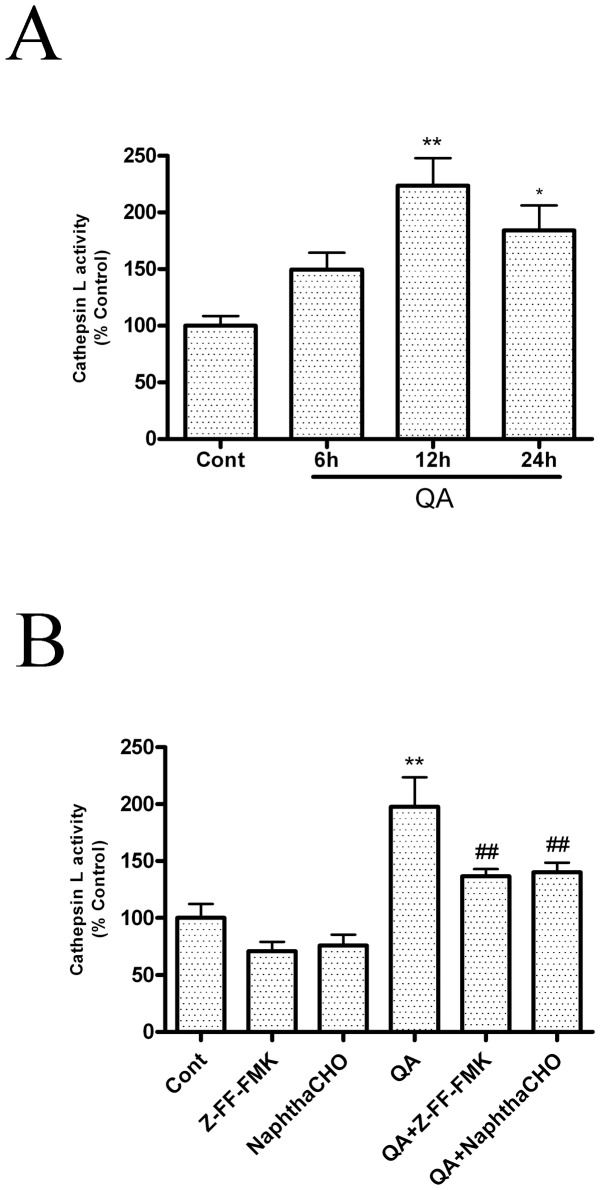
Figure 4. Activation of cathepsin L after QA treatment. A: The time-course of QA-induced increases in cathepsin L activity.
Animals were treated as described in the legend to Figure 3. Cathepsin L activity in striatal lysates was determined with a fluorescence-based assay. B: Effects of Z-FF-FMK and NaphthaCHO on cathepsin L activation. Rats were pretreated with intrastriatal injection of Z-FF-FMK (5 nmol) or NaphthaCHO (5 nmol) 10 min prior to intrastriatal injection of QA (60 nmol) and were killed 12 h later. Control animals received vehicle injection only. Striata were dissected for assay of cathepsin L activity using a fluorescence-based assay kit. The results were expressed as percent of control (vehicle injection) after performing statistical analysis. Bars represent Mean ± SEM (N = 6). Statistical comparisons were carried out with one-way ANOVA followed by Bonferroni t-test. * P<0.05 vs. control group; ** P<0.01 vs. control group; ## P<0.01 vs. QA-treated group.

