
Figure 2. Results of the random effects analysis of the main effect (Belief>Photo).
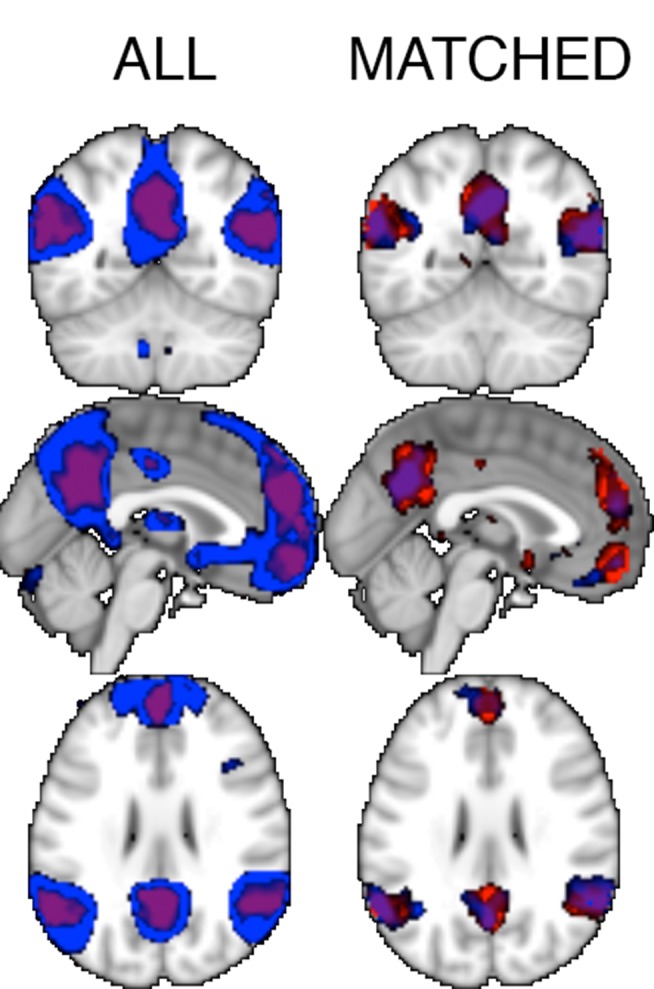
In blue, regions identified in NT participants (N = 462) as responding to the false belief condition more than the false photo condition (p<0.001 uncorrected). Results from ASD participants are in red (p<0.001, shown in purple because of overlap). Data are overlayed on the MNI template brain. The volume is centered at [0 mm −54 mm 28 mm], showing the LTPJ and RTPJ (visible in the coronal and axial slices), the PC (in all slices) and the MPFC (in the sagittal slice).