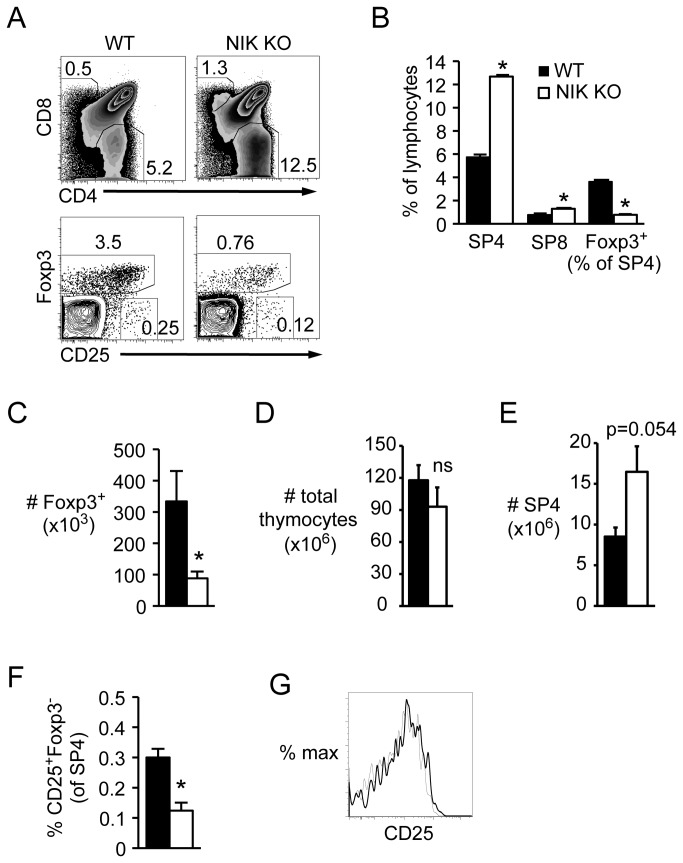
Figure 1. Decreased Foxp3+ Tregs and CD25+Foxp3- Treg precursors in NIK KO thymus.
Single-cell suspensions of nucleated thymocytes from intact NIK KO or WT mice were stained with the indicated fluorescently conjugated antibodies and analyzed by flow cytometry. A, Top plots are gated on lymphocytes, bottom plots are gated on SP4. Numbers indicate percent of gated cells. B, Quantitation of cell percentages among lymphocytes or SP4. C-E, Quantitation of absolute number of SP4 Foxp3+ thymocytes, total thymocytes, and SP4 thymocytes per mouse, respectively. F, Quantitation of Treg precursors as a percent of SP4. G, Overlay of CD25 expression gated on SP4 Foxp3+ cells; bold line, NIK KO; narrow line, WT. Data in bar graphs represent mean ± SEM of n=4 mice per group in one representative experiment of two.

