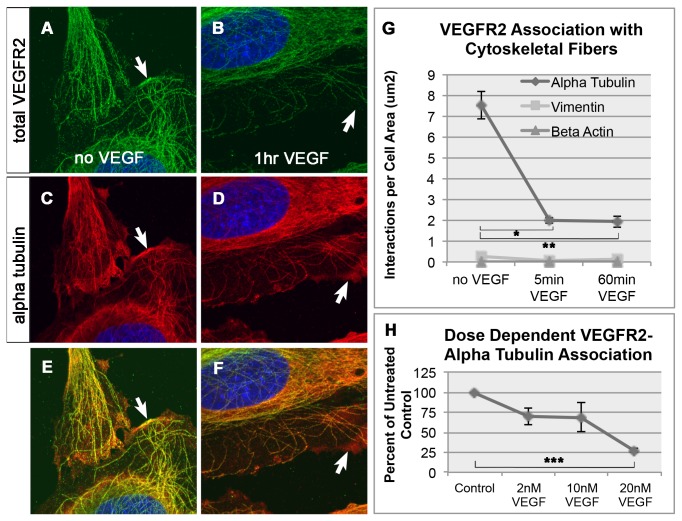
Figure 2. VEGF-dependent changes in VEGFR2-microtubule association.
Untreated endothelial cells stained with total VEGFR2 (A), alpha tubulin (C) and merged image (E). Arrows in A, C and E denote VEGFR2 colocalizing with alpha tubulin at the cell surface. Endothelial cells stained with total VEGFR2 (B), alpha tubulin (D) and merged image (F) after treatment with 20nM VEGF for 60 minutes. Arrows in B, D and F show decreased colocalization of VEGFR2 and alpha tubulin at the cell surface. (G) Changes in the interaction between VEGFR2 and alpha tubulin, beta actin and vimentin proteins upon treatment with VEGF. Graph from one of three representative experiments is shown and bars represent standard error of the mean (SEM) within this experiment. (H) Graph showing dose response curve for VEGFR2-alpha tubulin association. This graph shows the mean result of three independent experiments normalized to untreated control. The error bars represent standard error between experiments. Significant differences (denoted by asterisks) determined using ANOVA and Tukeys post-hoc HSD test. Threshold of significance (alpha) was set to p<0.05. *p=0.0000075, **p= 0.0000073, ***p= 0.0056639.

