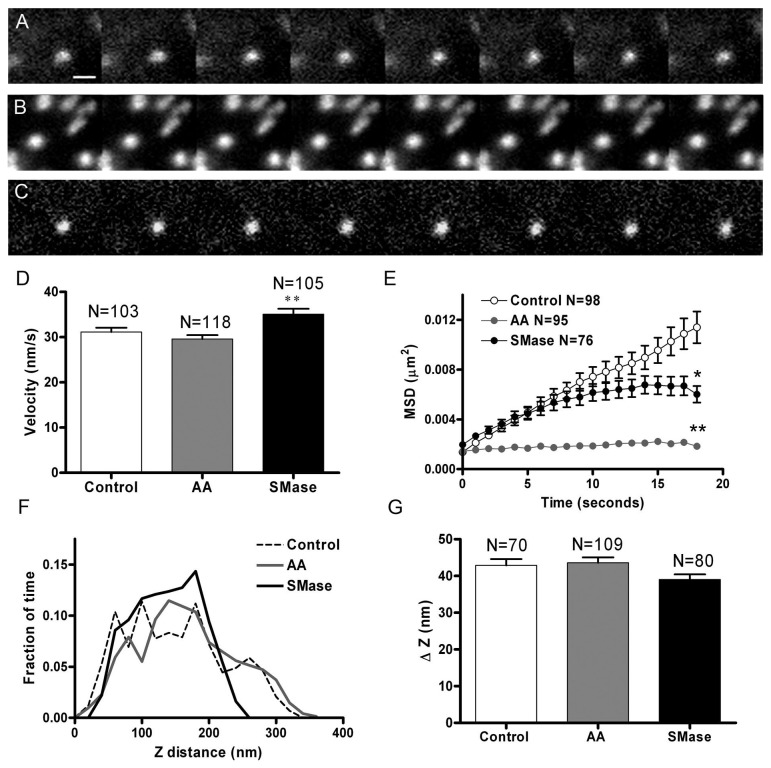
Figure 2. SNARE microdomain lateral motion is restricted in cells incubated with SMase and AA.
The dynamics of the microdomains formed by expression of GFP-SNAP-25 were studied in time-lapse images taken at 1 s intervals in control chromaffin cells or cells treated with 100 μM AA or 1 U/ml SMase for 30 min. Shown are images separated by 5 s intervals of SNARE clusters in a control cell (A), a cell incubated with AA (B), and SMase (C). The microdomains display lateral mobility in the XY plane, which was studied by measuring the centroid coordinates, which were then used to calculate the average path speed (D) for the vesicles in control (N = 103), AA (N = 118), and SMase-treated cells (N = 105). E. Mean square displacement (MSD) vs time plot curves indicate a caged motion in the case of SMase-treated cells (downward curve) and almost immobile behaviour in AA-treated cells (flat curve, error bars smaller than symbols). The variations in the intensity of fluorescence indicate the different mobility in the Z plane for the same patches and were used to calculate Z distance distributions using 25 nm bin width (F), and increments (G). Bar represents 1 µm in A. *P<0.05 and **P<0.01 compared to controls using ANOVA with Dunnett’s multiple comparison test.

