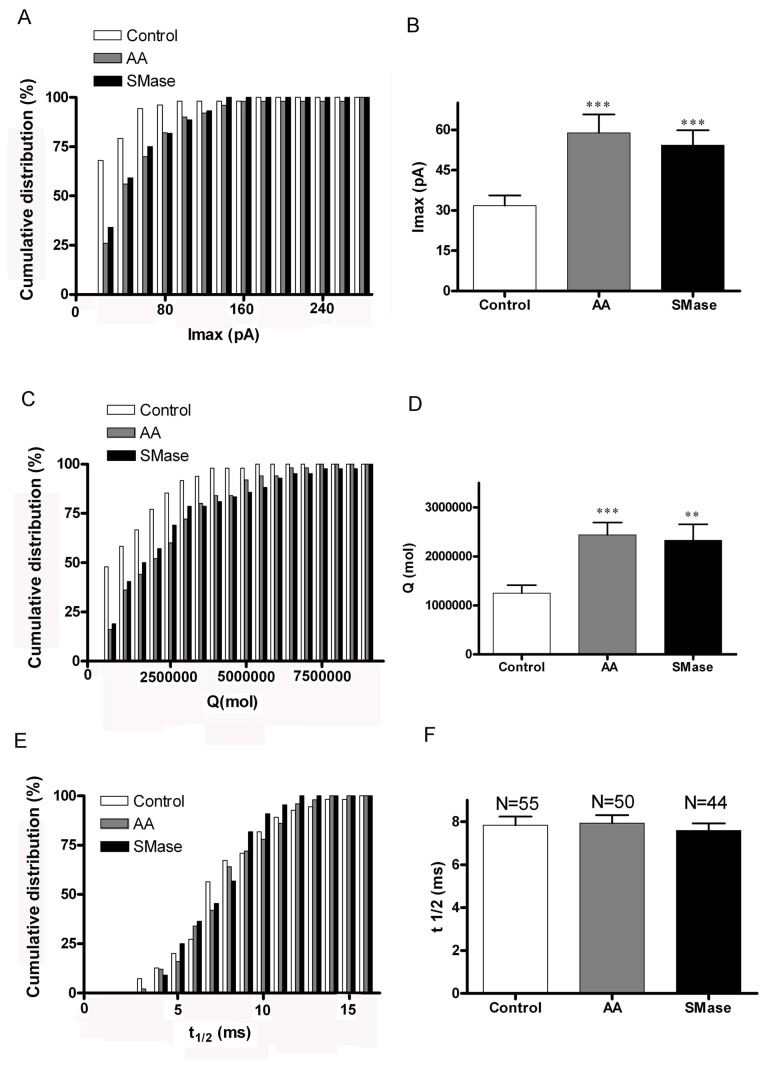
Figure 6. Signalling lipids dramatically enhance the amount of catecholamines released by event.
Main amperometric parameters of the secretory spikes obtained from control (N=55 cells), as well as AA-treated cells (N=50) and SMase-treated cells (N=44). This analysis was performed by averaging the spikes obtained in every individual cell. A. Cumulative distribution of the Imax values averaged for individual cells. 20 pA bin width. B. The mean amplitude is enhanced by 2-fold in AA-treated cells and by 1.7-fold in SMase treated cells. C. Cumulative distribution of the averaged amount of catecholamine molecules released per event obtained for individual cells. 500.000 molecules/event bin width. D. Consequently, the mean value of released molecules per event increased by 2.1-fold in AA-treated cells and by 2-fold in cells incubated with SMase. E. Cumulative distribution of the t1/2 parameter averaged for individual cells. 1 ms bin width. F. Mean t1/2 parameter was slightly reduced with SMase-treatment (not significant at the statistical level. **P<0.01 and ***P<0.001comparing to control according to ANOVA with Dunnett’s test for multiple comparisons.

