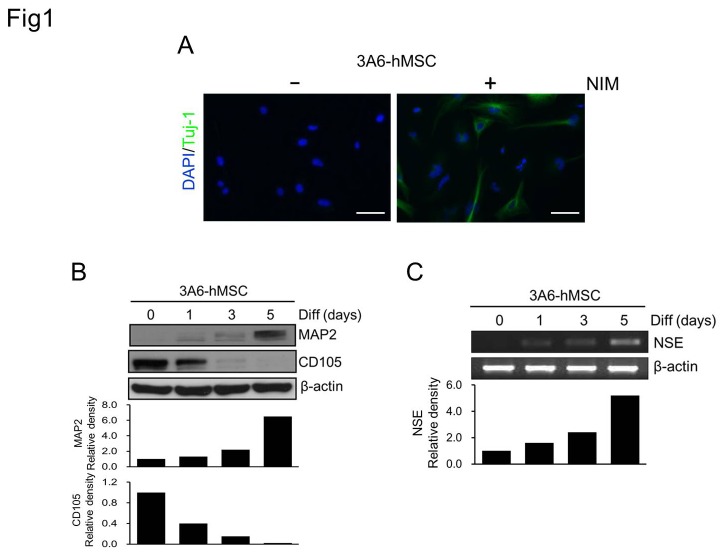
Figure 1. Cell fate transformation and neuronal induction of 3A6-hMSCs by NIM.
A. Detection of neuron-specific Tuj-1 expression in differentiating 3A6-hMSCs cultured in NIM for 5 days. Note that Tuj-1 is expressed in the soma and also in induced neurites. Scale bars, 50 µm. B, C. Induced expression of neuron-specific MAP2 (B) and NSE (C) and reduced expression of the mesenchymal cell marker, CD105 (B), during 3A6-hMSC neuronal differentiation (Diff). Western blot and semi-quantitative RT-PCR analyses, respectively. β-actin expression served as an internal control. The bar graphs (bottom) represent the relative density of the MSC marker (CD105), neuron marker (MAP2), and NSE determined by scanning densitometric tracings.

