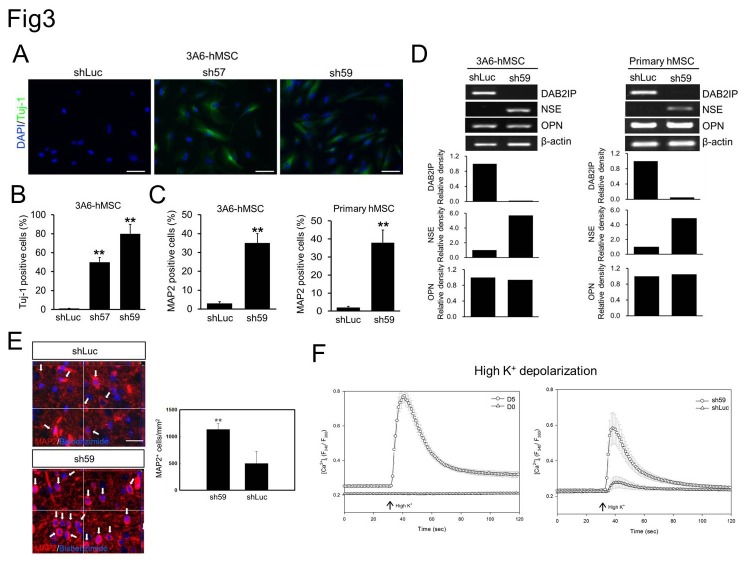
Figure 3. Effect of DAB2IP expression on neuronal differentiation of hMSCs.
A. Immunofluorescence staining of Tuj-1 expression (green) in 3A6-hMSCs infected with lentivirus-containing shRNAs against luciferase (shLuc) or DAB2IP (sh57 and sh59). B. Quantification of data presented in A as a percentage of Tuj-1-positive cells relative to the total number of cells. Bars represent mean ± SEM (**p < 0.01, t test). C. Flow cytometry of MAP2-positive DAB2IP-KD hMSCs. Bars represent mean ± SEM (**p < 0.01, t test). D. Semi-quantitative RT-PCR analysis of DAB2IP, OPN and NSE expression in shRNA-expressing hMSCs. β-actin served as an internal control. The bar graphs (bottom) represent the relative density of DAB2IP, NSE, and OPN as determined by scanning densitometric tracings. E. A representative three-dimensional image of bisbenzimide-labeled primary hMSCs (shLuc and sh59; blue fluorescence) implanted in rat brain. The white arrows indicate the implanted MAP2-positive hMSCs (red fluorescence) in rat brain (left). Scale bar: 50 µm. Quantification of implanted MAP2-positive cells in both the DAB2IP-KD sh59-treated rats and control mock shLuc-treated rats (right). Bars represent mean ± SEM (**p < 0.01, t test). F. The primary hMSCs were treated with NIM (D5; circle) or without NIM (D0; triangle) for 5 days (left) and with shLuc or DAB2IP-KD sh59 (right) to induce differentiation and to the neuronal lineage. A change in [Ca2+]i after stimulation with high K+ buffer was used to verify neuron-like function. The arrow indicates the time point of stimulation.

