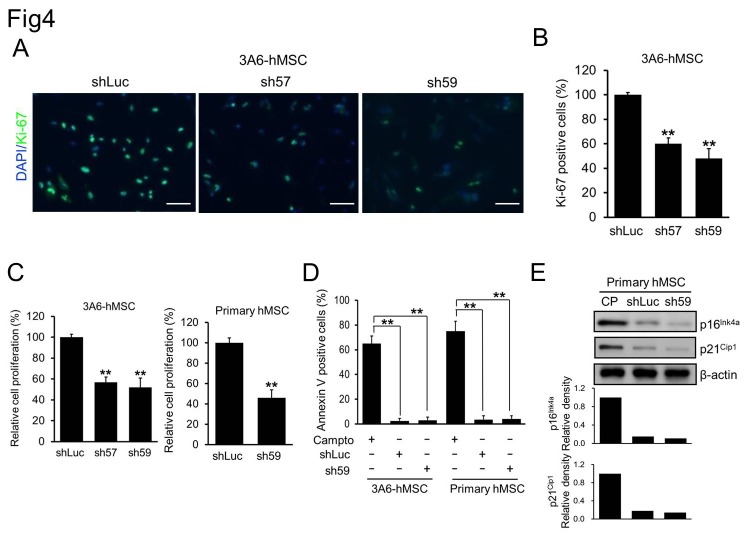
Figure 4. Correlation between the reduction of DAB2IP expression and hMSC proliferation.
A. Immunofluorescence staining of Ki-67 (green) in shRNA-transfected 3A6-hMSCs. B. Quantification of Ki-67-positive shRNA-transfected 3A6-hMSCs. Bars represent mean ± SEM (**p < 0.01, t test). C. WST-1 cell survival and proliferation assay of shLuc, sh57 and sh59 cells. Bars represent mean ± SEM (**p < 0.01, t test). D. Percentage of apoptotic cells from each hMSC cell line treated with or without 6 µM camptothecin (Campto; positive control) for 4 h as determined by flow cytometry of annexin V-positive cells. Bars represent mean ± SEM (**p < 0.01, t test). E. Western blotting of factors involved in cellular senescence of hMSCs. Continuously passaged (CP) of hMSCs served as the positive control. The bar graphs (bottom) represent the relative density of p16Ink4a and p21Cip1 as determined by scanning densitometric tracings.

