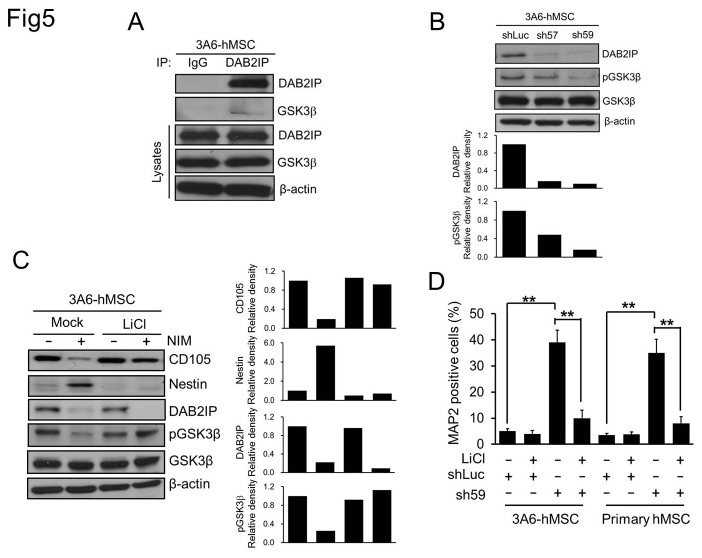
Figure 5. Effect of GSK3β on mesenchymal-to-neuroepithelial transition of hMSCs.
A. Western blot analysis of whole-cell lysates from naïve 3A6-hMSCs. IP: immunoprecipitation. B. Western blot analysis of DAB2IP and Ser9 phosphorylated GSK3β (pGSK3β) in sh57 and sh59 DAB2IP-KD 3A6-hMSCs compared with shLuc control cells. The bar graphs (bottom) represent the relative density of DAB2IP, and pGSK3β as determined by scanning densitometric tracings. C. Western blot analysis for the MSC marker CD105 and the neuronal progenitor cell marker Nestin in naïve or LiCl-pretreated 3A6-hMSCs cultured with or without NIM. β-actin served as an internal control. The bar graphs (bottom) represent the relative density of CD105, Nestin, DAB2IP, and pGSK3β as determined by scanning densitometric tracings. D. Flow cytometry of MAP2-positive DAB2IP-KD hMSCs. Bars represent mean ± SEM (**p < 0.01, t test).

