
Figure 4. Continuous enzymatic assay for proDer p 3 maturation by Der p 1.
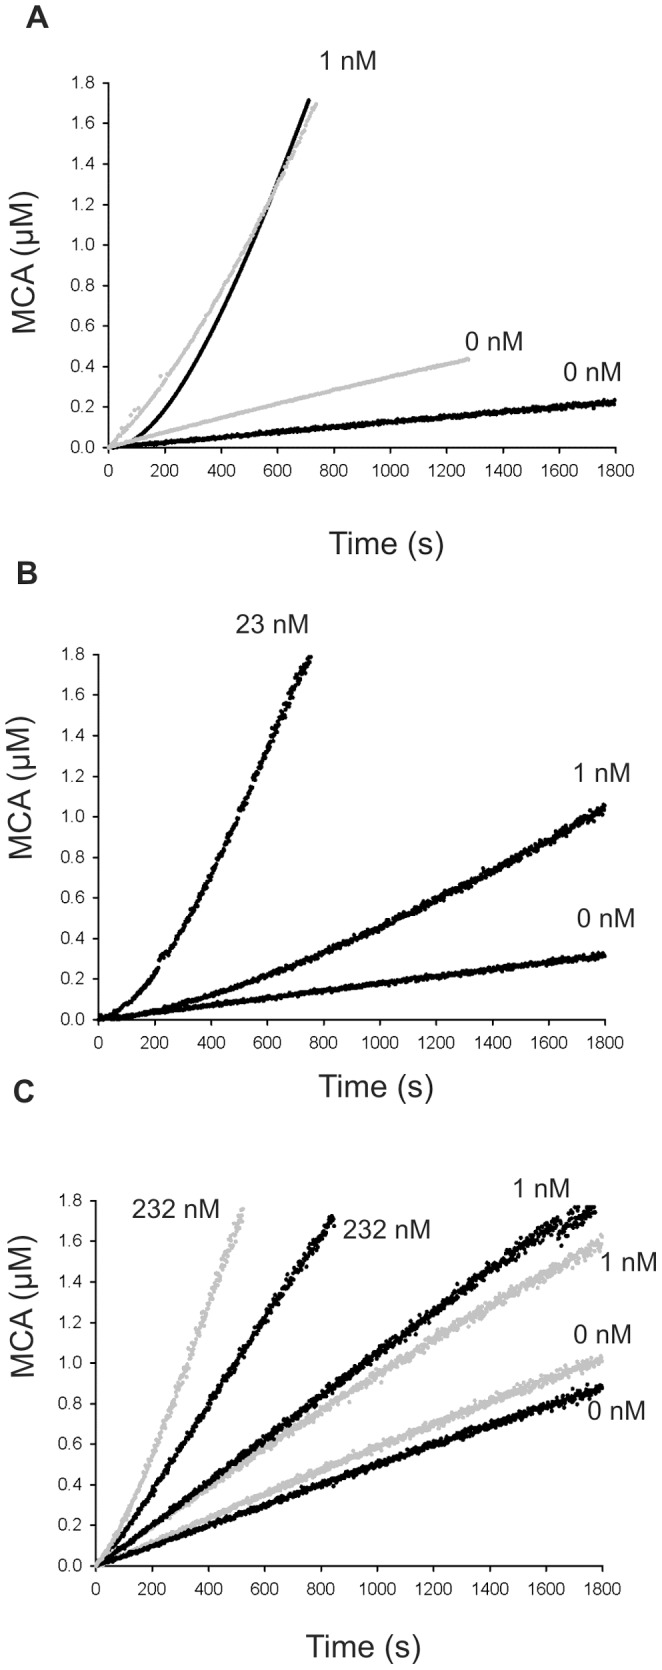
A: proDer p 3 (black) and P2A (gray), B: P5A and C: P8A (black) and P-A (gray) mutants. Substrate hydrolysis (10 µM IEGR-MCA) versus time curves showing the activation of 12.5 nM zymogens by Der p 1 with the indicated concentrations in 50 mM polybuffer 2 at 37°C.