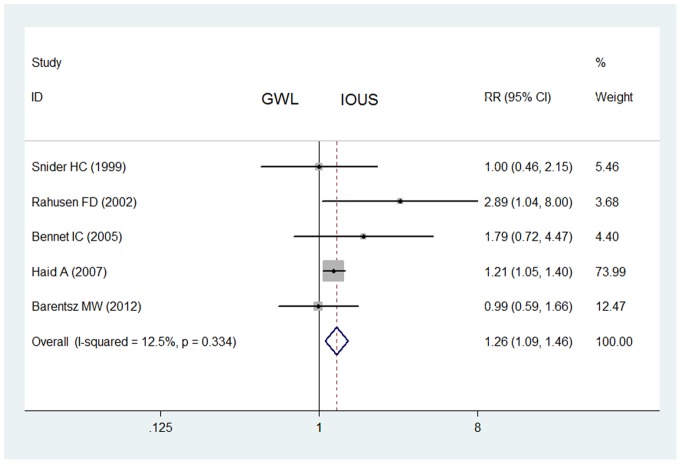
Figure 4. Impact of IOUS on rates of negative margins of non-palpable breast cancers (prospective studies).
Forest plot for meta-analysis of prospective studies: rate of negative margins of non-palpable breast cancers in IOUS group compared with that in GWL group. The width of the horizontal line represents the 95% CI of the individual study, and the square proportional represents the weight of each study. The diamond represents the pooled RR and 95% CI.

