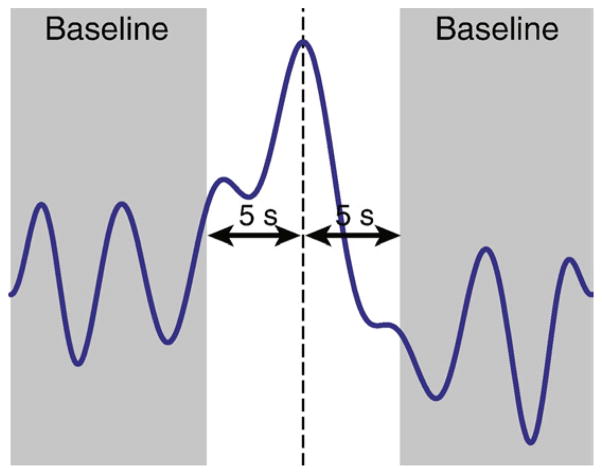
Fig. 2.
Procedure to determine the prominence of the HRF peak. Any data more than 5 s before or after the peak (vertical dashed line) is considered as baseline (shaded area). The prominence of the peak is then quantified by the ratio of the peak amplitude to the standard deviation of the baseline. In the example shown, this ratio was equal to 4.0.

