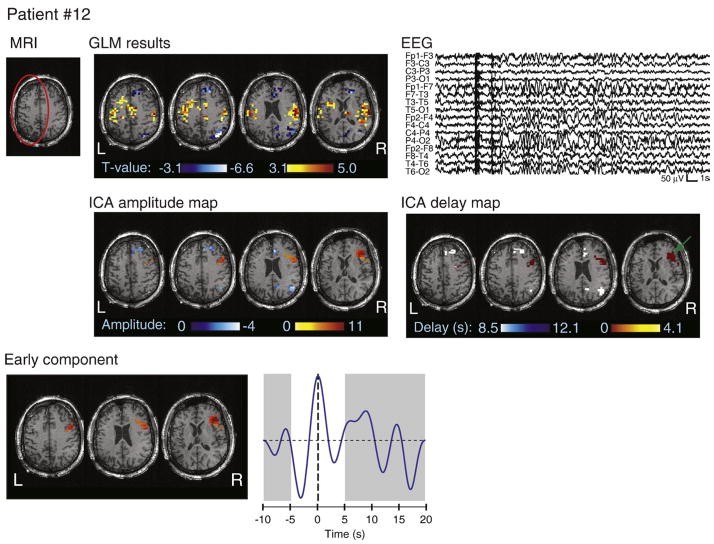
Fig. 8.
MRI, EEG, and analysis results for patient #12. The atrophy is circled in red on the MRI. Note that the color scale on the ICA delay map represents HRF peak timing, with the earliest activation indicated by a green arrow. The spatial topography of a right frontal component is also shown, with the fitted HRF peaking at 0 s. The GLM map did not detect a significant BOLD response in this region.

