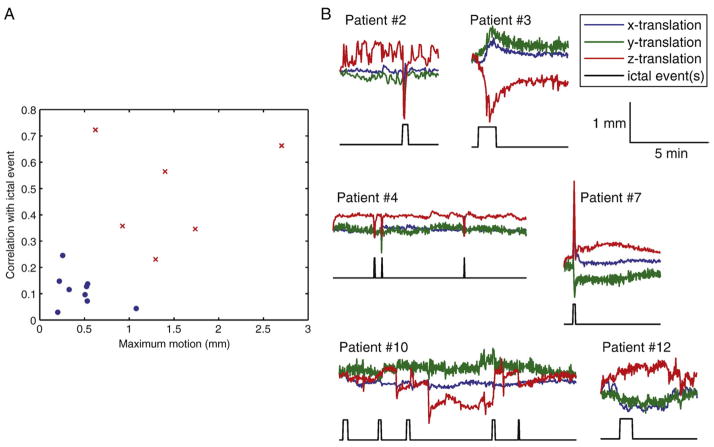
Fig. 9.
Identification of patients with seizure-correlated motion. A: Scatterplot showing the maximum motion and correlation between motion and ictal events for all patients. Six patients, shown as red crosses, stand out from the other patients, shown as blue dots, due to large motion and high correlation between motion and ictal events. B: Time courses of the 3 translation parameters and periods of ictal activity for the 6 patients identified in part A.

