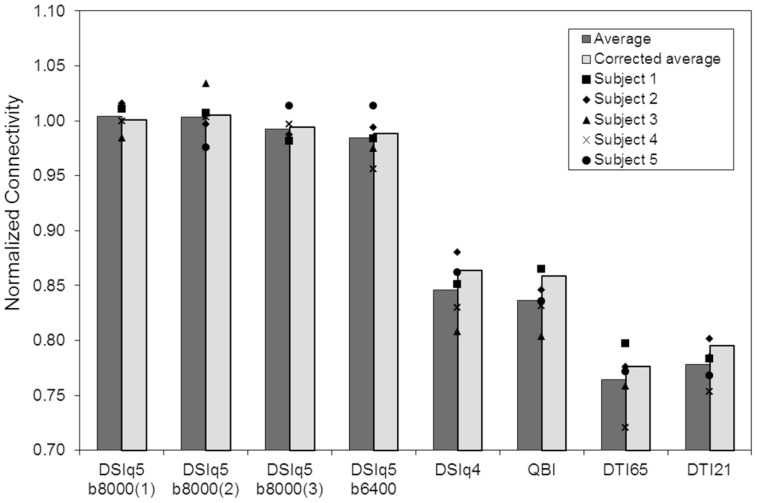
Figure 3. Normalized connectivity as a function of the diffusion encoding scheme.
Dark gray bars represent averages across the five subjects and symbols indicate data for individual subjects. Light gray bars represent the averaged normalized connectivity after fiber limitation, ensuring that every connection matrix of an individual subject is built using the same number of fibers.

