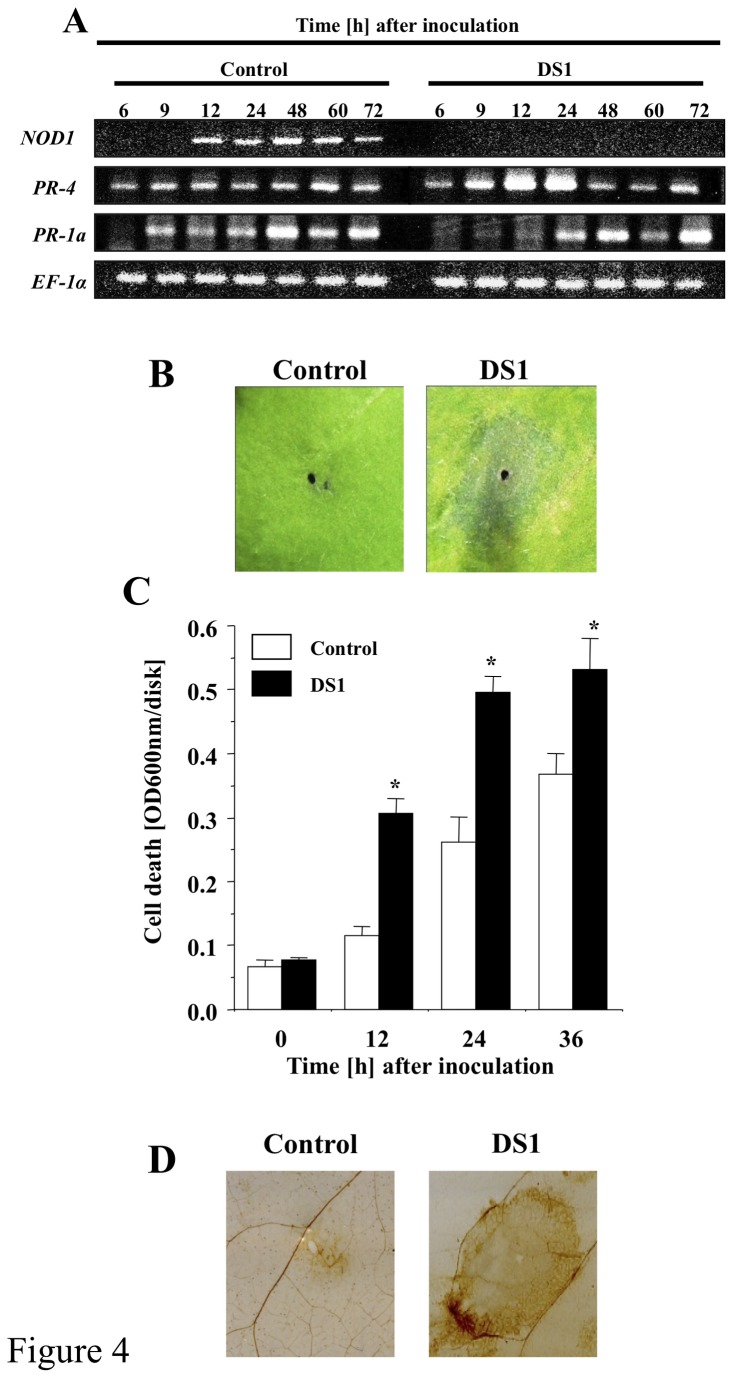
Figure 4. Up-regulation of defense-related responses in DS1 plants against R. solanacearum infection.
(A) Total RNA was isolated from control (Control) and DS1 plants (DS1) 6 to 72 h after inoculation with R. solanacearum. Expression values of DS1, PR-1a, PR-4, and NbEF-1α were analyzed by semi-quantitative RT-PCR with specific primers for NbPR-1a, NbPR-4, DS1, and NbEF-1α. (B) HR-like lesion formation in DS1 plant in response to R. solanacearum infection. Control and DS1 plants were infiltrated with R. solanacearum. Pictures of N. benthamiana leaves taken 36 hours after bacterial infiltration. (C) Cell death was determined by Evans blue staining. Values are means of four replicate experiments with SD. Asterisks denote values significantly different from those of empty PVX control (*; P < 0.05, t-test). (D) ROS production was visualized 48 h after inoculation with R. solanacearum by DAB staining as described in Materials and Methods.

