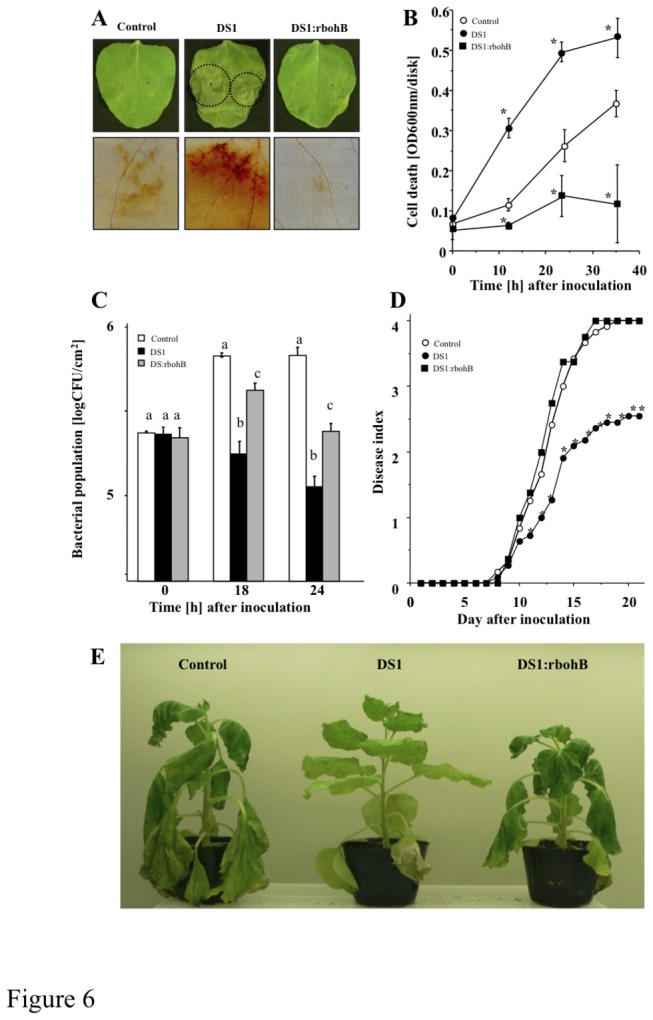
Figure 6. Role of NbrboHB in DS1 phenotype.

Control, DS1, and DS1:NbrboHB (DS1:rbohB) double-knockdown plant leaves were infiltrated with R. solanacearum. (A) Photograph of HR-like lesion was taken 36 h after inoculation Dot lined circles showed lesion developed areas. ROS production was visualized 48 h after inoculation by DAB staining as described in Materials and Methods. Bars indicated 500 nm. (B) Cell death was determined by Evans blue staining (OD600 disk-1, see Materials and Methods). (C) Bacterial population was determined by plating at specified time points. Values are means of four replicate experiments with SD. Different letters show significant differences among control, DS1, and double-knockdown plants (ANOVA test). (D) Disease development of bacterial wilt was rated daily on a 0–4 disease index in control (open circles), DS1 (solid circles), or DS1:NbrboHB (closed squares) plants. Values are means of four replicate experiments with SD. Different letters show significant differences among controls, DS1, and double-knockdown plants (p<0.05 ANOVA). (E) Characteristic symptoms in control, DS1, and DS1:rboHB plants. Photograph was taken 12 days after inoculation with R. solanacearum.
