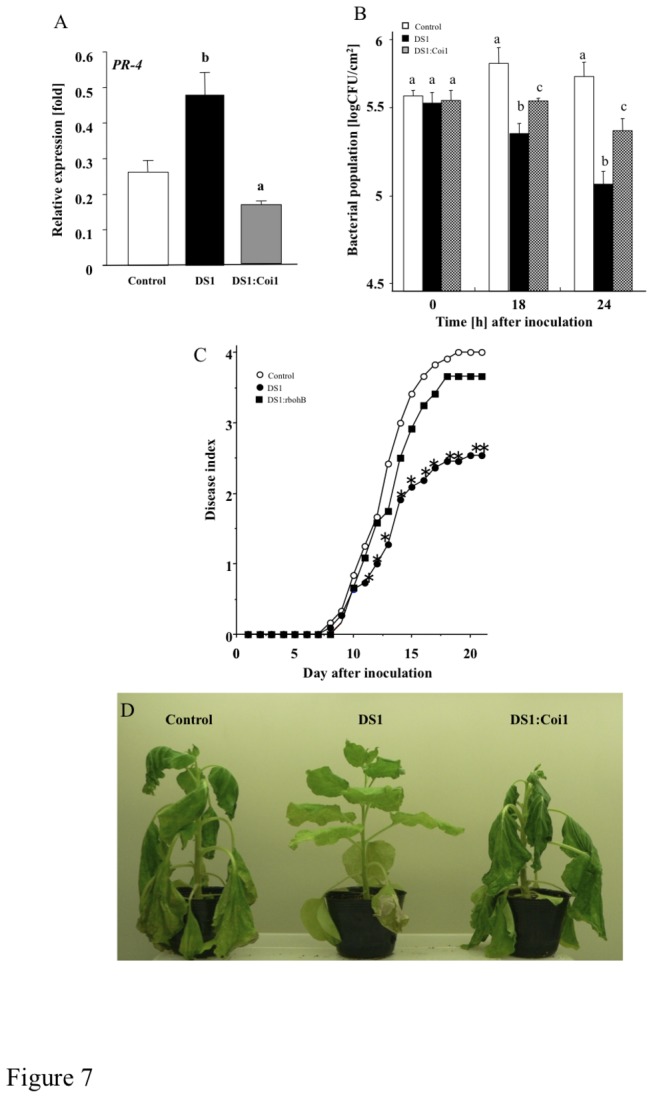
Figure 7. Role of jasmonic acid pathway in DS1 phenotype.

Control, DS1, and DS1:Coi1 double-knockdown plant leaves were infiltrated with R. solanacearum. (A) Total RNA was isolated from control (Control), DS1 (DS1), and DS1:NbCoi1 (DS1:Coi1) double-knockdown plant 24 h after inoculation with R. solanacearum. Expression values of PR-4 are expressed as [Qty] after normalization to actin. Values represent means and SD from triplicate experiments. Different letters show significant differences among control, DS1, and double-knockdown plants (ANOVA test). (B) Bacterial population was determined by plating at specified time points. Values are means of four replicate experiments with SD. Different letters show significant differences among controls, DS1, and double-knockdown plants (p<0.05 ANOVA). (C) Disease development of bacterial wilt was rated daily on a 0–4 disease index in control (open circles), DS1 (solid circles), or DS1:Coi1 (closed squares) plants. Values are means of four replicate experiments with SD. Asterisks denote values significantly different from those of empty PVX control (*; P < 0.05, t-test). (D) Characteristic symptoms in control, DS1, and DS1:Coi1 plants. Photograph was taken 12 days after inoculation with R. solanacearum.
