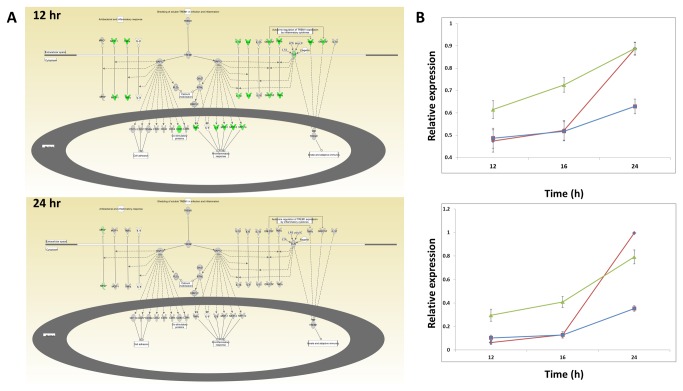
Figure 7. Pathway enrichment analysis.
A) Network diagram of TREM1 signaling canonical pathway from IPA. Colored nodes indicate genes with RNA expression measures above background in murine lungs infected with influenza virus. Green indicates higher expression in X31-infection than PR-infection at the indicated time point (>= 2 Fold). Grey color indicates that the difference in expression is < 2 fold. B) Average expression measure of all genes above background annotated as belonging to the “TREM1 signaling” (top) and “Differential Regulation of Cytokine Production in Macrophages and T Helper Cells by IL-17A and IL-17F” (bottom) pathways. PR8=red, VN=blue, X31=green. Error bars represent the SEM.

