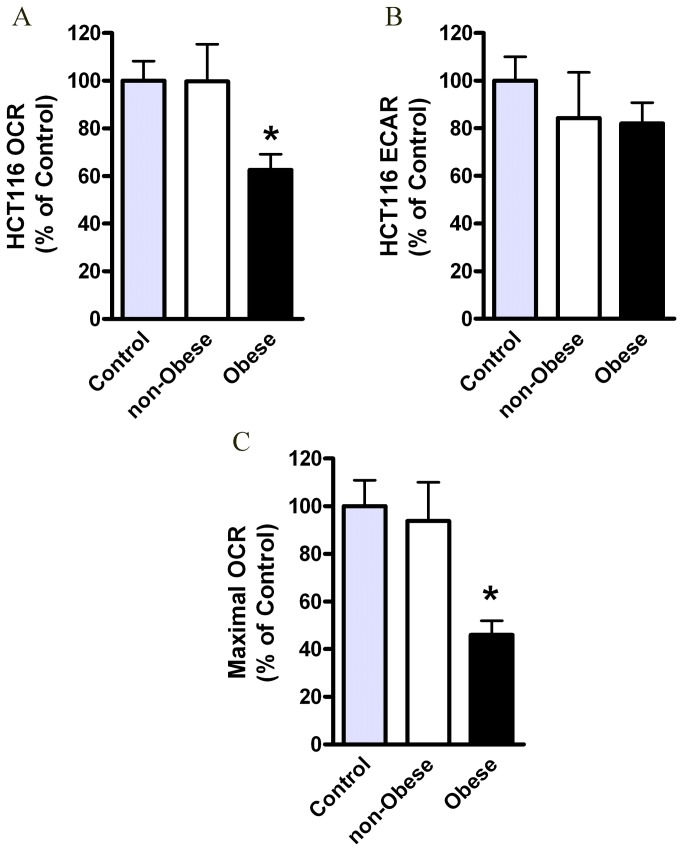
Figure 4. Effects of the obese CM on HCT116 cells respiration.
HCT116 cells were treated for 24 hours with DMEM (control), CM collected from visceral AT of non-obese subjects (n=4) or obese subjects (n=10) and analyzed for their OCR (A) and ECAR (B) levels by using the XF24 Analyzer. *, P< 0.05 vs. non-obese or control (Student’s t-test). (C) Maximal OCR levels following FCCP (0.4 µM) were measured using the XF24 Analyzer. Control (n=9), non-obese (n=4), obese (n=10). *, P< 0.05 vs. non-obese sample (Mann Whitney test). Results were normalized to protein concentration and expressed as percentage of control.

