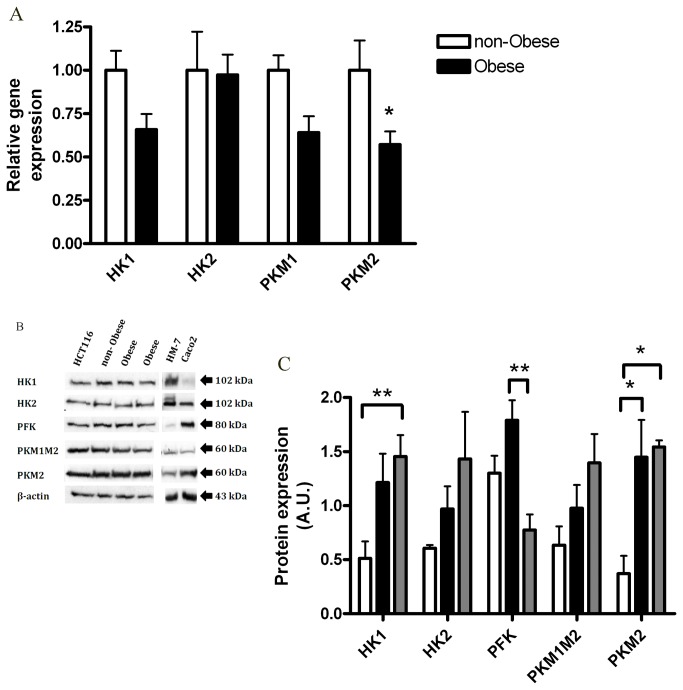
Figure 5. Effects of the obese CM on HCT116 glycolysis.
HCT 116 cells were treated for 24 hours with CM collected from visceral AT of non-obese subjects (n=4) or obese subjects (n=9). (A) Bax gene expression levels were detected using quantitative real-time PCR. *, P< 0.05 vs. respective non-obese sample of each gene (Mann Whitney test). (B) Cell lysates were analyzed by Western blot. HM-7 and Caco2 were used as controls (see Results) (C), Densitometric analysis of the Western blot data. *, P> 0.01, **, P<0.05 (Two Way ANOVA, Bonferroni test).

