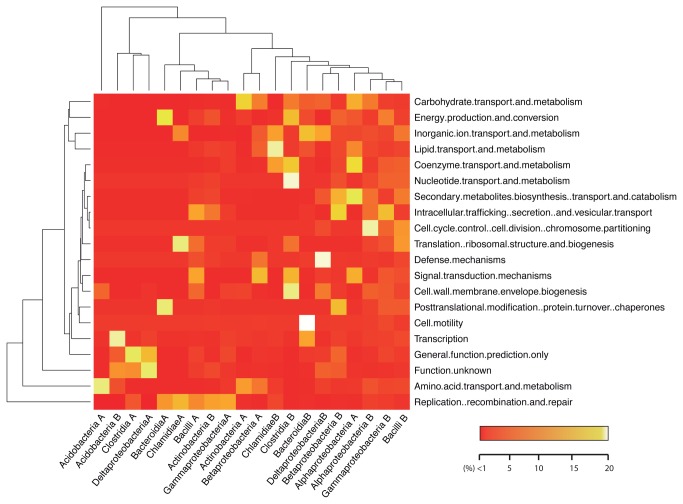
Figure 4. Metagenomic profiles of Skin metagenomes, split by taxa.
Classification was made first by taxonomic assignation using PhymmBL, and then functional classification was based on EggNOG using HMM classification. Counts were normalized by sample and taxa using log transformation. The color gradient indicates the level of representation for that taxa. Hierarchical clustering was performed by function and taxon.

