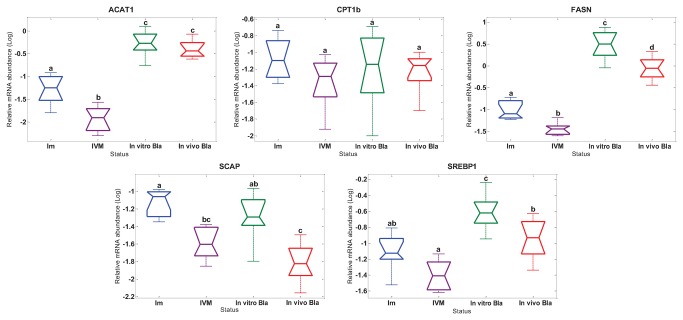
Figure 4. Relative poly (A) + mRNA abundance of target genes.
Box plot of Log converted data (with median, 25th and 75th quartiles and max and mix values) based on single oocytes/embryos preparation: immature oocytes, n=8 (Im); in vitro matured oocytes, n=8 (IVM); in vitro produced blastocysts, n=7 (In vitro Bla); in vivo produced blastocysts, n=8 (In vivo Bla). Different superscripts indicate significant differences (P< 0.05).

