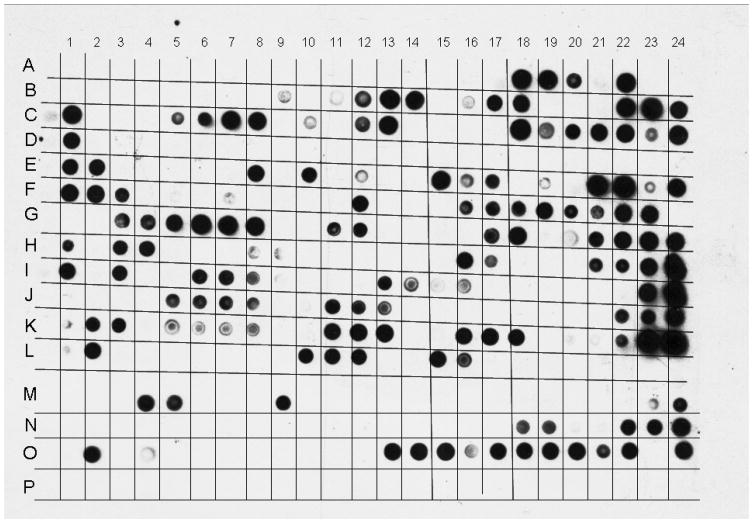
Figure 4.
Anti-His dot blot showing expression of four individual 96-well boxes of expressed clones. The first two rows of a given 96-well box are spotted here in row “A,” the next two in row “B”, and so on through row “D,” where the last two rows of a given box are included. Cells were induced with mitomycin C, lysed, and 2 μL of lysate spotted for visualization. Array runs 16 rows by 24 columns. An example of positive expression is visible at CI3, which corresponds to the gene pX02-5 (GI: 6470156). An example of low but acceptable expression is seen in C19, which corresponds to gene pX02-15 (GI: 6470166.)

