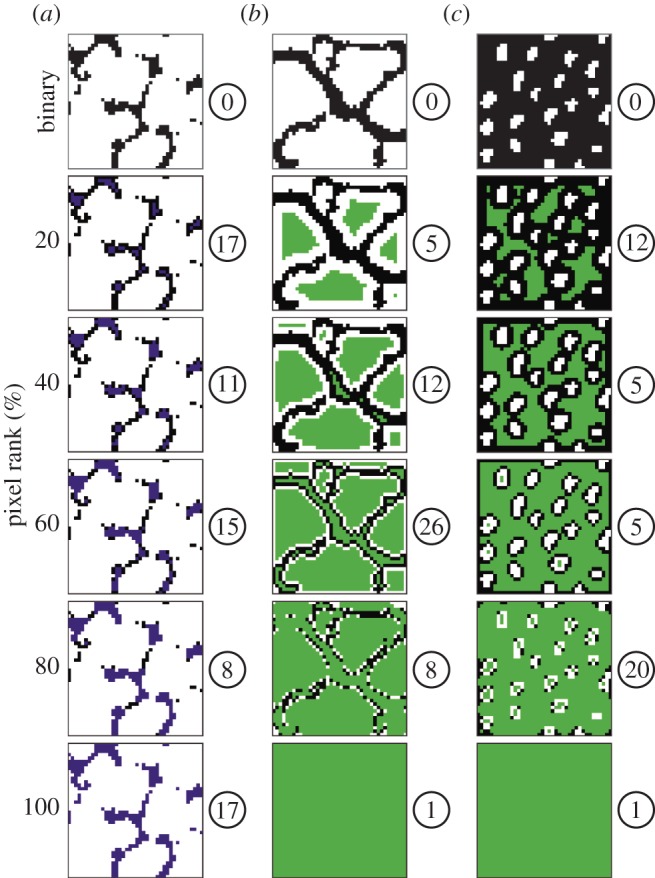
Figure 4.

Thumbnails showing examples of expanding subregions and the number of connected components within them. Subregions are displayed as coloured pixels and shown in 20% increments. Examples of three species are shown, each from a different morphological group. (a) D. insularis (Group 3; figure 2 and table 1), (b) O. hirtellus (Group 2; figure 2 and table 1), (c) A. odoratum (Group 1; figure 2, table 1). Binary images at the top of each column correspond to the binary images in figure 3c,f,i, with black pixels as the background and white pixels as the foreground. (a) shows a sequence of expanding subregions within a network having only the background pixels as nodes, which was used to derive feature τ1. Pixels added to this network following SC computations are shown in purple. (b,c) show a sequence of expanding subregions within a weighted network having all pixels as nodes, which was used to derive feature τ2. Pixels added to this network following SC computations are shown in green. The number of connected components present in each subregion is shown in a white circle to the right of each image.
