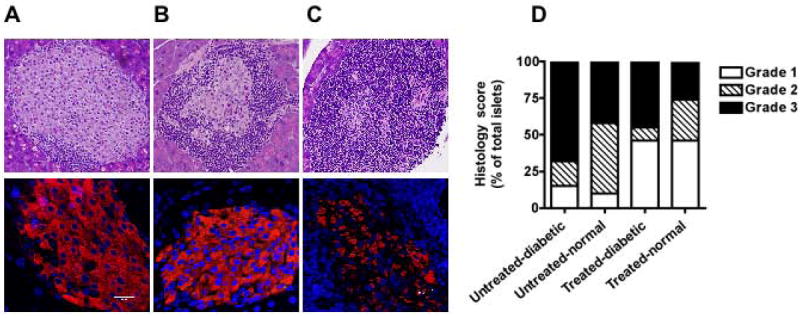
Figure 4. Reduction in invasive infiltration of islets in protected mice.

Top row shows H & E stained sections of pancreata displaying islets with no/minimal (Grade 1, A), moderate (Grade 2, B) and severe cellular infiltration (Grade 3, C) (original magnification × 200). Bottom row shows confocal images of islets displaying insulin-producing beta cells (red) in corresponding sections. Nuclei were stained with Hoechst (blue). Bar indicates 20 μM (original magnification × 630).
D. Histological scores of pancreata in indicated sets of mice are shown.
