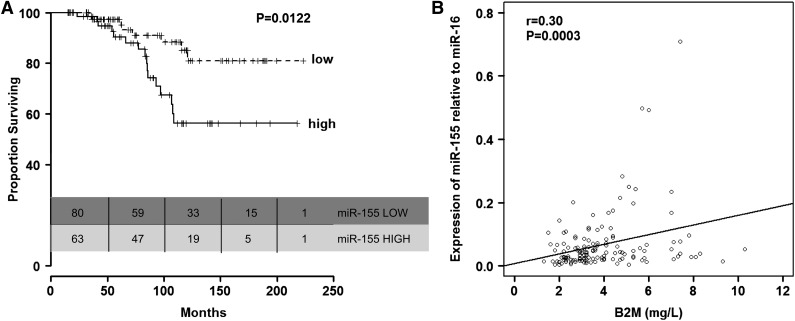
Figure 3.
Relationship between relative miR-155 expression levels in plasma and overall survival in patients in group C. (A) Kaplan-Meier survival curves according to relative expression levels of miR-155 in plasma (low, up to 56th percentile; high, above 56th percentile). (B) Correlation between plasma levels of miR-155 and serum B2M levels.

