
Figure 4.
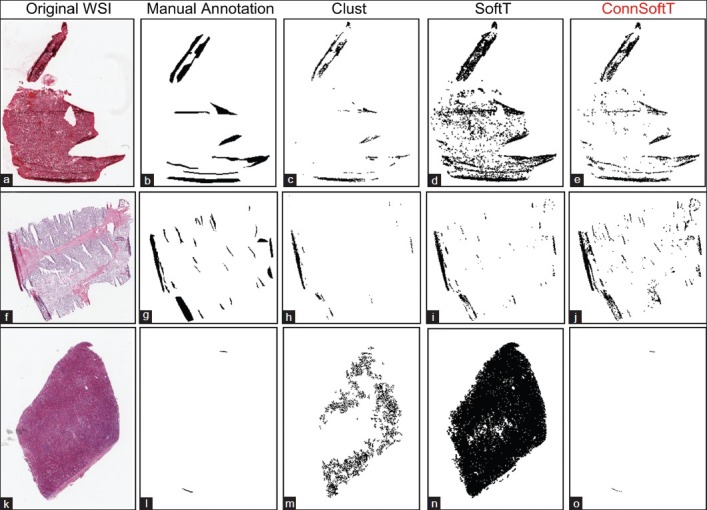
Comparison of the performance of the three tissue-fold detection methods: Clustering, Soft threshold, and Connectivity-based soft threshold. Tissue folds detected by the three methods: Clust (c, h, and m), SoftT (d, i, and n), and ConnSoftT (e, j, and o) for an ovarian serous adenocarcinoma whole-slide image (a) and two kidney clear cell carcinoma WSIs (f and k). If tissue folds in a WSI vary in color (a and f), the Clust method under segments. On the other hand, if a WSI has no tissue folds in (k), Clust over segments. Because of the fixed thresholding of the SoftT method, it over segments WSIs (a and k) with darker tissue regions and under segments WSIs (f) with lighter tissue folds