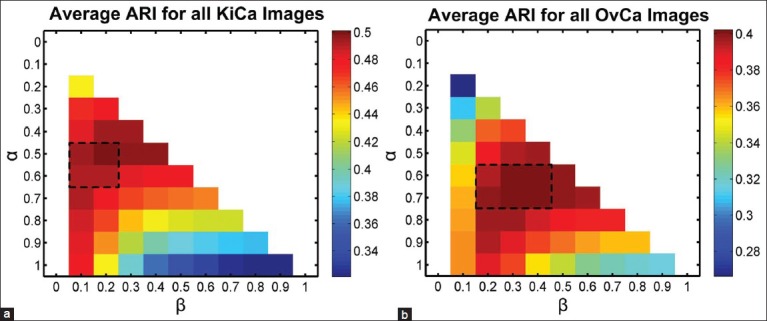
Figure 6.

Sensitivity of Connectivity-based soft threshold method to parameter selection. Heat map for the average performance (adjusted Rand index) of tissue-fold detection using ConnSoftT method with different parameters. The average was calculated using the entire data set of 105 images for both kidney clear cell carcinoma (a) and ovarian serous adenocarcinoma (b). The performance of the method is quite similar in the range of parameters (marked by a dashed rectangle) selected during cross-validation [Figure 5], indicating that tissue-fold detection is not sensitive to small parameter changes
